Note
Go to the end to download the full example code.
Generating SIP signatures#
This example highlights some of the capabilities of pyGimli to generate spectral induced polarization (SIP) signatures.
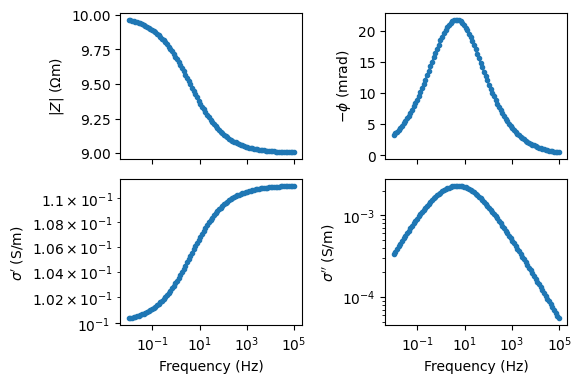
Generate a Cole-Cole signature
from pygimli.physics.SIP import modelColeColeRho
import numpy as np
import pygimli as pg
import matplotlib as mpl

f = np.logspace(-2, 5, 100)

Z = modelColeColeRho(f, rho=10, m=0.1, tau=0.04, c=0.5)

fig, axes = pg.plt.subplots(2, 2, figsize=(15 / 2.54, 10 / 2.54), sharex=True)

ax = axes[0, 0]
ax.semilogx(f, np.abs(Z), '.-')
ax.set_ylabel(r'$|Z|$ ($\Omega$m)')
ax = axes[0, 1]
ax.semilogx(f, -np.angle(Z) * 1e3, '.-')
ax.set_ylabel(r'$-\phi$ (mrad)')
ax = axes[1, 0]
Y = 1 / Z
ax.loglog(f, np.real(Y), '.-')
ax.set_xlabel('Frequency (Hz)')
ax.set_ylabel(r"$\sigma'$ (S$/$m)")
ax = axes[1, 1]
ax.loglog(f, np.imag(Y), '.-')
ax.set_xlabel('Frequency (Hz)')
ax.set_ylabel(r"$\sigma''$ (S$/$m)")

for ax in axes.flat:
    ax.xaxis.set_major_locator(mpl.ticker.LogLocator(numticks=5))
fig.tight_layout()
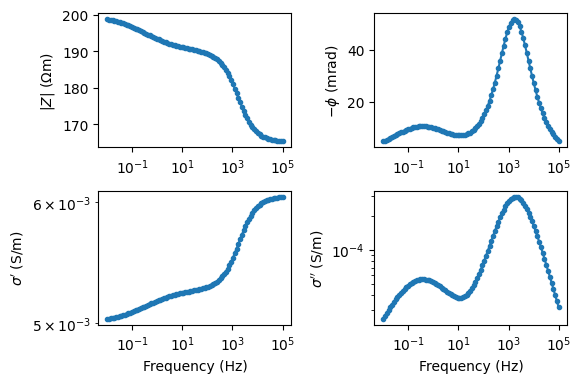
Generate a double Cole-Cole signature
from pygimli.physics.SIP import modelColeColeRho
import numpy as np
import pygimli as pg

f = np.logspace(-2, 5, 100)

# term1
Z1 = modelColeColeRho(f, rho=1, m=0.1, tau=0.5, c=0.5)
# term2
Z2 = modelColeColeRho(f, rho=1, m=0.25, tau=0.0001, c=0.8)
# create sum
rho0 = 100
Z = rho0 * (Z1 + Z2)

fig, axes = pg.plt.subplots(2, 2, figsize=(15 / 2.54, 10 / 2.54))
ax = axes[0, 0]
ax.semilogx(f, np.abs(Z), '.-')
ax.set_ylabel(r'$|Z|$ ($\Omega$m)')
ax = axes[0, 1]
ax.semilogx(f, -np.angle(Z) * 1e3, '.-')
ax.set_ylabel(r'$-\phi$ (mrad)')
ax = axes[1, 0]
Y = 1 / Z
ax.loglog(f, np.real(Y), '.-')
ax.set_xlabel('Frequency (Hz)')
ax.set_ylabel(r"$\sigma'$ (S$/$m)")
ax = axes[1, 1]
ax.loglog(f, np.imag(Y), '.-')
ax.set_xlabel('Frequency (Hz)')
ax.set_ylabel(r"$\sigma''$ (S$/$m)")

for ax in axes.flat:
    ax.xaxis.set_major_locator(
        mpl.ticker.LogLocator(numticks=5)
    )
fig.tight_layout()